IC Markets Home Sign in Web Trader Contact Us
IC Markets Social IC Markets Social

مركز المعلومات
للمتداولين الجادينs

  • ABOUT US
  • OPEN LIVE ACCOUNT
  • OPEN DEMO ACCOUNT
  • TRADE NOW
  • VISIT OUR BLOG
IC Markets Social
  • ABOUT US
  • OPEN LIVE ACCOUNT
  • OPEN DEMO ACCOUNT
  • TRADE NOW
  • VISIT OUR BLOG
November 22, 2022North_American_Stocks_ptIC Markets

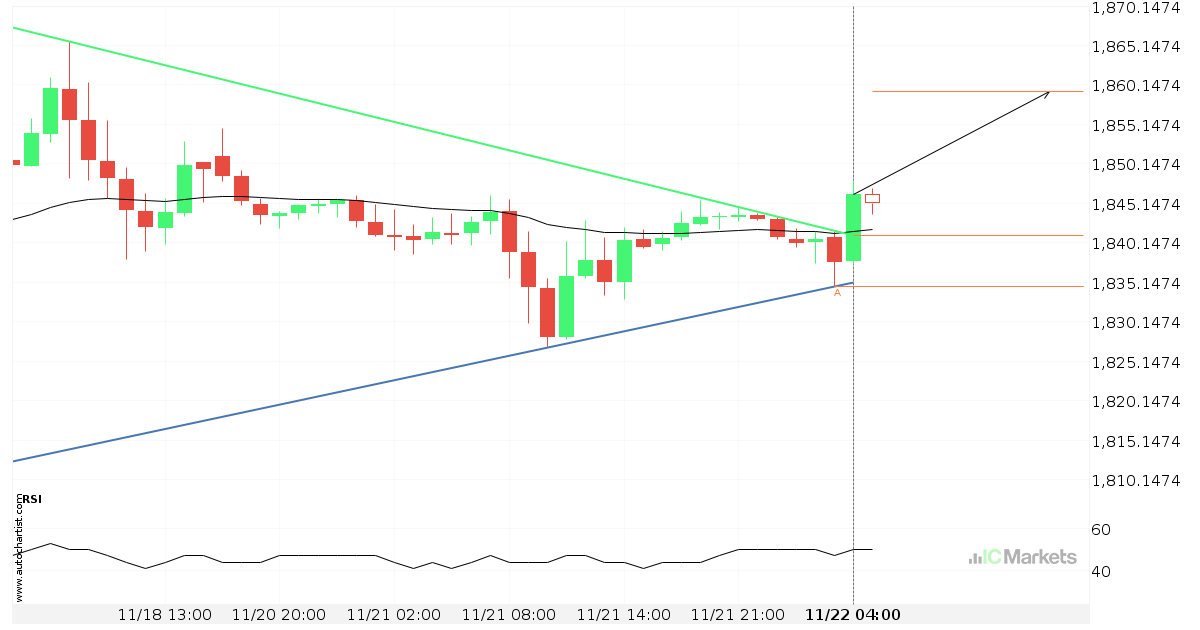
Resistance line breached by US Small Cap 2000 Index

US Small Cap 2000 Index has broken through the resistance line which it has tested twice in the past. We have seen it retrace from this line before, so one should wait for confirmation of the breakout before trading. If this new trend persists, a target level of around 1859.2883 may materialize within the next […]

Read more
November 18, 2022North_American_Stocks_ptIC Markets

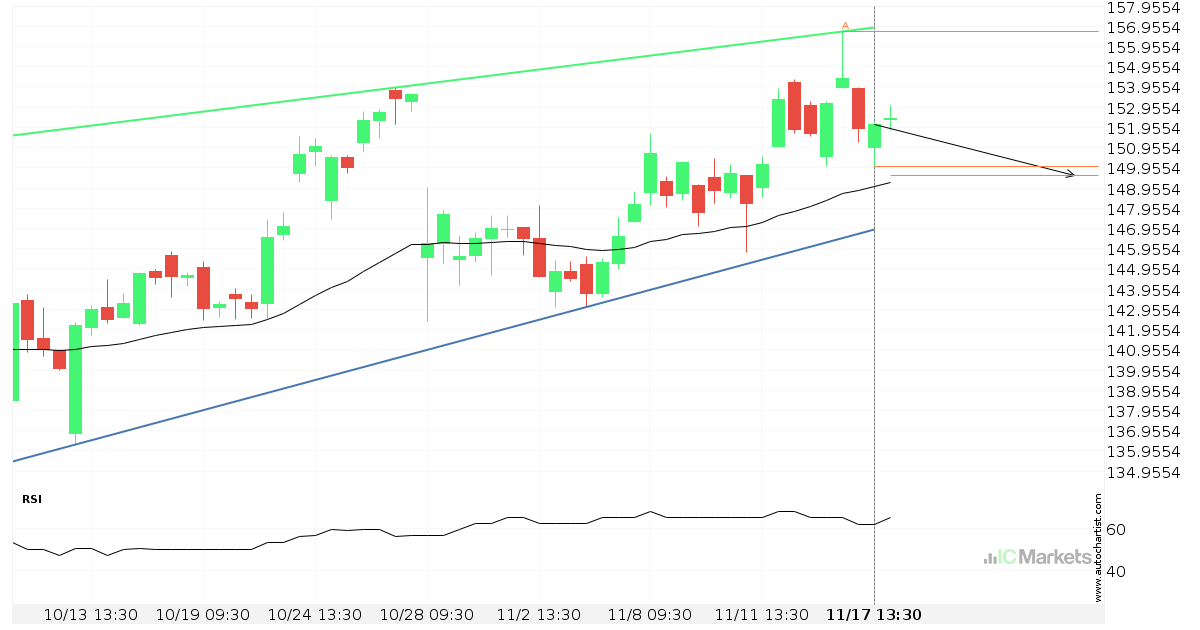
Possible breach of support level by AbbVie

AbbVie is moving towards a support line which it has tested numerous times in the past. We have seen it retrace from this line before, so at this stage it isn’t clear whether it will breach this line or rebound as it did before. If AbbVie continues in its current trajectory, we could see it […]

Read more
November 17, 2022North_American_Stocks_ptIC Markets

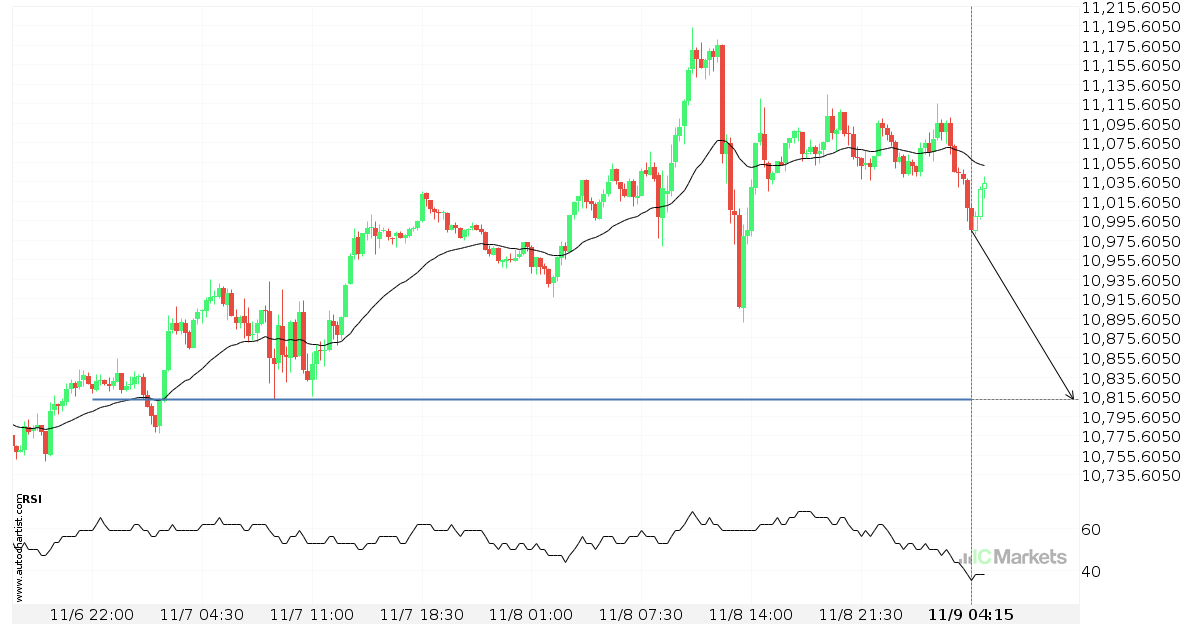
US Tech 100 Index broke through important 11667.0000 price line

US Tech 100 Index has broken through a support line. It has touched this line numerous times in the last 7 days. This breakout shows a potential move to 11544.1602 within the next 2 days. Because we have seen it retrace from this level in the past, one should wait for confirmation of the breakout.

Read more
November 16, 2022North_American_Stocks_ptIC Markets

What’s going on with Meta Platforms, Inc. – Class A Common Stock?

Those of you that are trend followers are probably eagerly watching Meta Platforms, Inc. – Class A Common Stock to see if its latest 25,79% move continues. If not, the mean-reversion people out there will be delighted with this exceptionally large 12 days move.

Read more
November 15, 2022North_American_Stocks_ptIC Markets

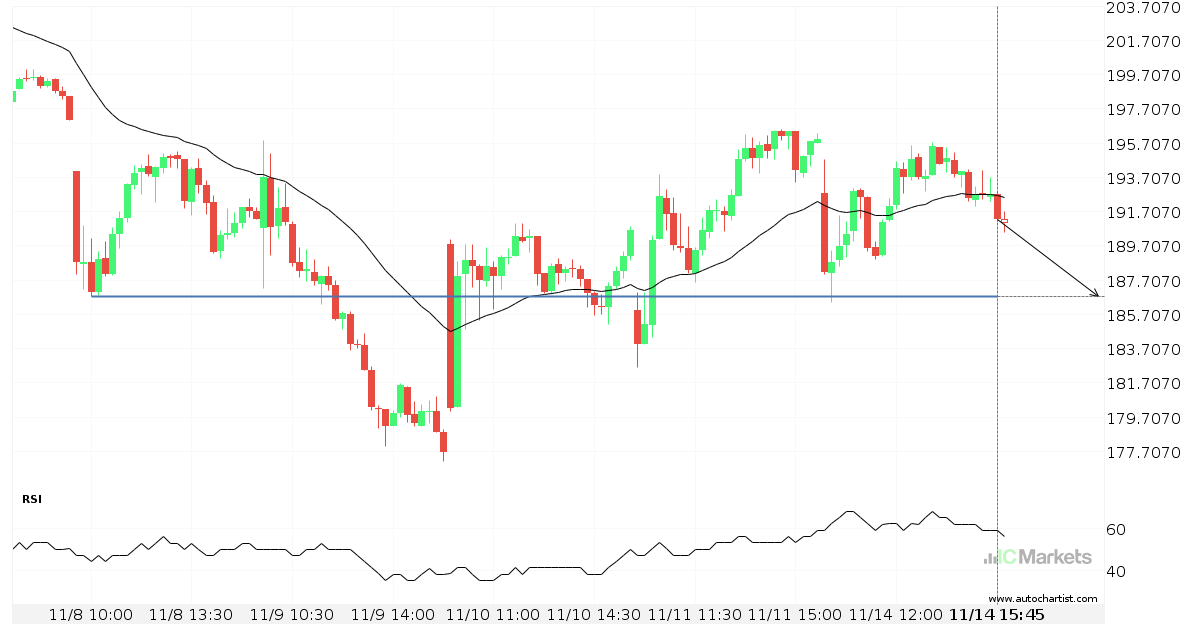
Either a rebound or a breakout imminent on Tesla Inc.

Tesla Inc. is heading towards a line of 186.7600. If this movement continues, the price of Tesla Inc. could test 186.7600 within the next 7 hours. But don’t be so quick to trade, it has tested this line numerous times in the past, so this movement could be short-lived and end up rebounding.

Read more
November 14, 2022North_American_Stocks_ptIC Markets

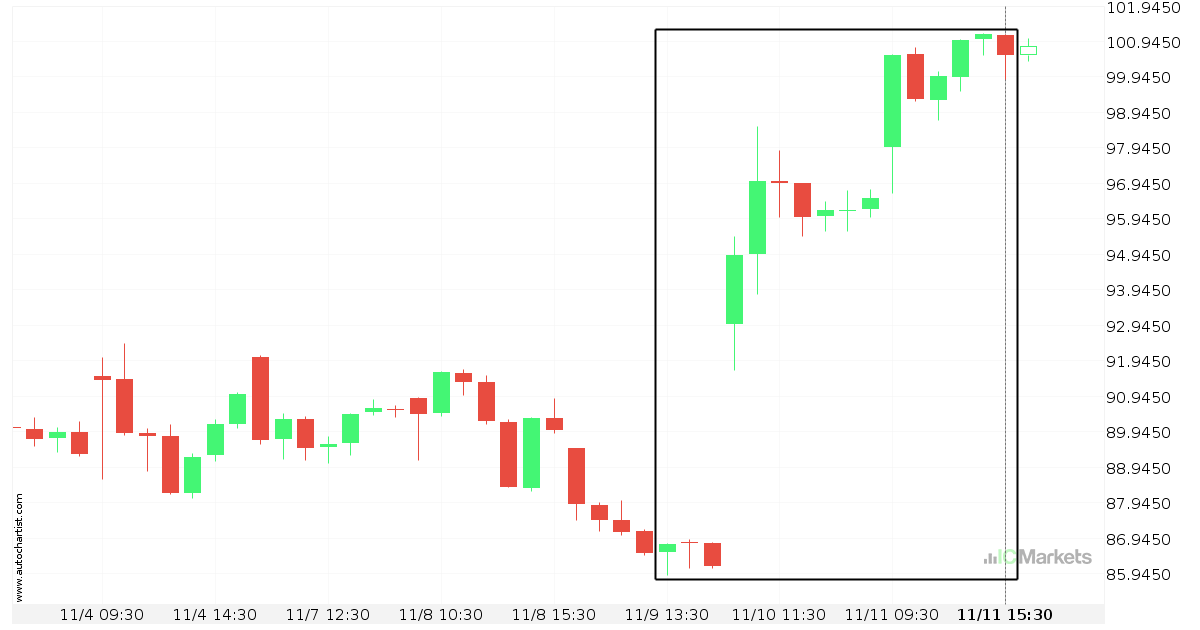
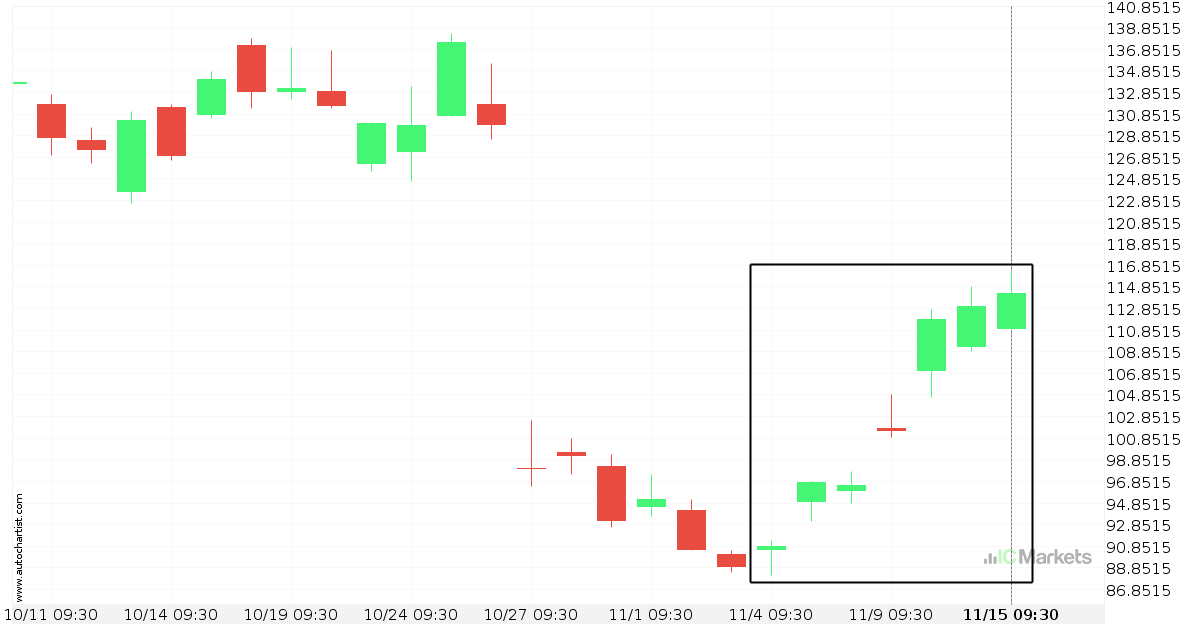
Huge bullish move on Amazon.Com Inc.

Amazon.Com Inc. has moved higher by 15,89% from 86.77 to 100.56 in the last 3 days.

Read more
November 11, 2022North_American_Stocks_ptIC Markets

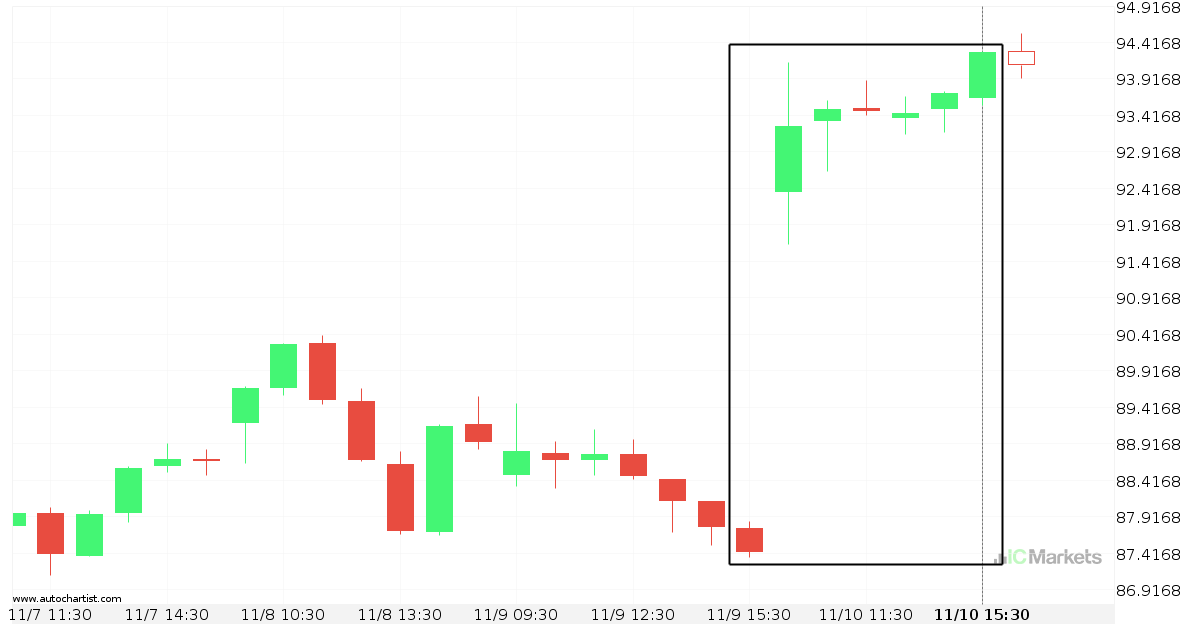
Huge bullish move on ALPHABET INC CLASS C

ALPHABET INC CLASS C has moved higher by 7,83% from 87.43 to 94.275 in the last 2 days.

Read more
November 10, 2022North_American_Stocks_ptIC Markets

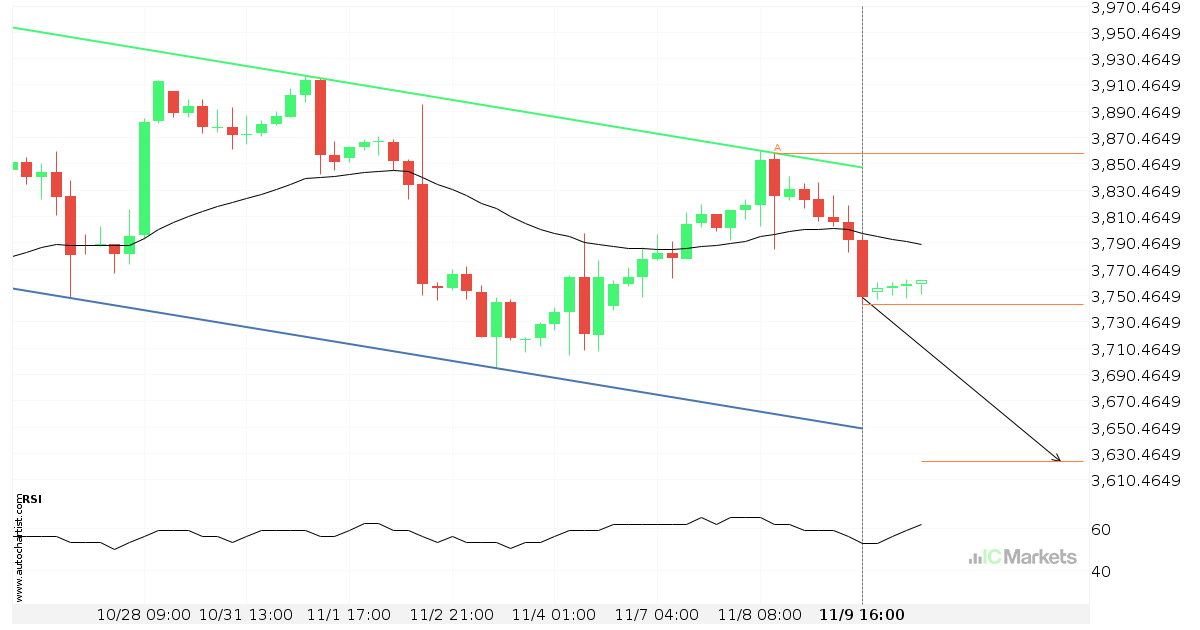
US SPX 500 Index approaching support of a Canal descendente

US SPX 500 Index is approaching the support line of a Canal descendente. It has touched this line numerous times in the last 15 days. If it tests this line again, it should do so in the next 3 days.

Read more
November 9, 2022North_American_Stocks_ptIC Markets

US Tech 100 Index – getting close to psychological price line

US Tech 100 Index is moving towards a support line. Because we have seen it retrace from this level in the past, we could see either a break through this line, or a rebound back to current levels. It has touched this line numerous times in the last 3 days and may test it again […]

Read more
November 8, 2022North_American_Stocks_ptIC Markets

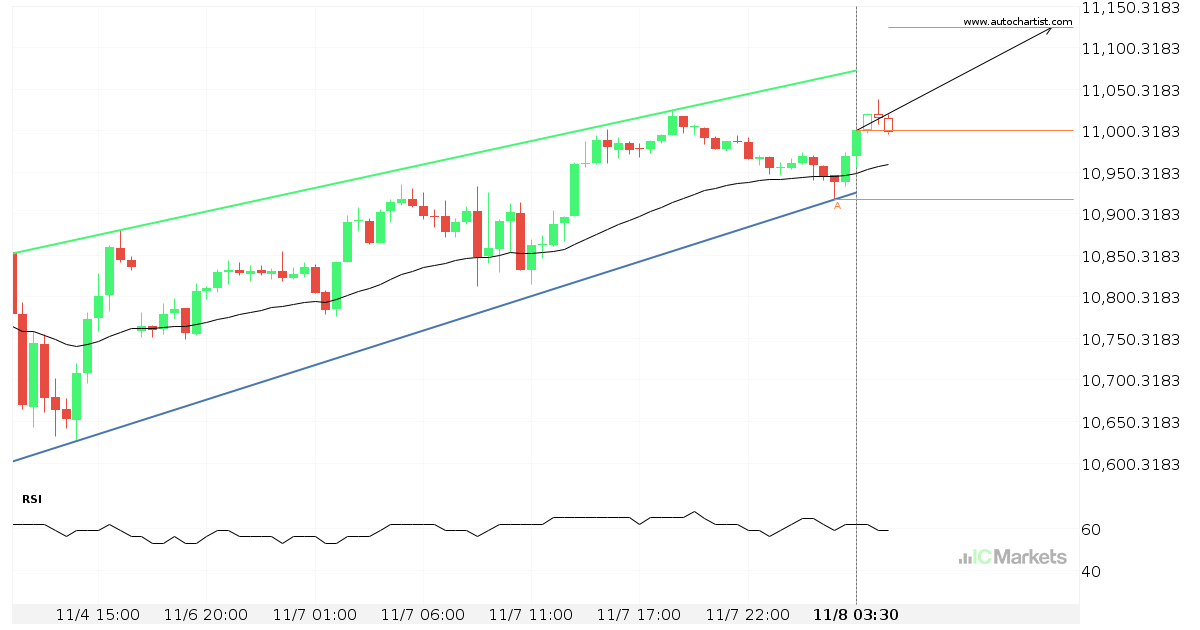
US Tech 100 Index approaching resistance of a Canal ascendente

US Tech 100 Index is approaching the resistance line of a Canal ascendente. It has touched this line numerous times in the last 4 days. If it tests this line again, it should do so in the next 10 hours.

Read more
  • 1
  • 2
  • 3
  • …
  • 43
  • 44
  • 45
  • 46
  • 47
  • 48
  • 49
  • …
  • 87
  • 88
  • 89

Recent Posts

  • US Wall Street 30 Index – المستوى الرئيسي – مقاومة
  • Brent Oil vs US Dollar – نموذج الرسم البياني – قناة صاعدة
  • Brent Oil vs US Dollar – نموذج الرسم البياني – قناة صاعدة
  • Hong Kong 50 Index – نموذج الرسم البياني – مثلث صاعد
  • Hong Kong 50 Index – รูปแบบกราฟ – สามเหลี่ยมขาขึ้น

Recent Comments

    Translation


     Edit Translation

    فتح الحساب وتمويله بشكل فوري

    تداول خلال دقائق!

    ابدأ اختبر حساب تجريبي مجاني

    نبذة عن IC Markets Global

    • مركز المساعدة
    • لماذا تختار IC Markets Global؟
    • التنظيم
    • الوثائق القانونية
    • اتصل بنا

    مواصفات التداول

    • الفروقات والعمولات
    • مجموعة المنتجات
    • ساعات التداول
    • التمويل
    • السحب

    تداول الفوركس

    • استعراض الحسابات
    • افتح حساب
    • إطلاق Web Trader


    Forex Trading

    • Accounts Overview
    • Open an Account
    • Launch Web Trader

    Trading Specifications

    • Spreads and Commissions
    • Range of Market
    • Trading Hours
    • Funding
    • Withdrawal

    About IC Markets

    • Chat with a Specialist 24/7
    • Why IC Markets
    • Regulation
    • Legal Documents
    • Contact Us

    IC Markets Global هو الاسم التجاري لشركة Raw Trading Ltd، التي تخضع لرقابة هيئة الخدمات المالية في سيشل (FSA) برقم ترخيص تاجر الأوراق المالية SD018.

    تحذير من المخاطر: ينطوي تداول الفوركس وعقود الفروقات على مخاطر عالية على رأس المال، لذا يُنصح بالتداول فقط بالأموال التي يمكنك تحمل خسارتها. قد لا يكون تداول الفوركس وعقود الفروقات مناسبًا لجميع المستثمرين، لذا يُرجى التأكد من فهمك التام للمخاطر المُحتملة، وطلب استشارة مستقلة عند الحاجة. يُرجى قراءة بيان إفصاح المخاطر والتأكد من فهمك التام له.

    الدول المحظورة : لا تقدم شركة Raw Trading Ltd خدماتها لسكان دول معينة مثل الولايات المتحدة الأمريكية وكندا والبرازيل وإسرائيل ونيوزيلندا وإيران وكوريا الشمالية (جمهورية كوريا الشعبية الديمقراطية) أو دولة يكون فيها مثل هذا التوزيع أو الاستخدام مخالفًا للقانون أو اللوائح المحلية.

    يجب أن تكون قد بلغت الثامنة عشرة من عمرك، أو السن القانوني المحدد في بلدك. بتسجيلك حسابًا لدى شركة رو تريدينج المحدودة، فإنك تُقر بأنك تُسجل بمحض إرادتك، دون أي تحريض من جانب Raw Trading Ltd .

    لا تُوجِّه Raw Trading Ltd موقعها الإلكتروني وخدماتها لأي فرد في أي دولة يُحظر فيها استخدام موقعها وخدماتها بموجب القوانين أو اللوائح المحلية. عند الوصول إلى هذا الموقع من دولة قد يُحظر فيها استخدامه، تقع على عاتق المستخدم مسؤولية ضمان توافق أي استخدام للموقع أو الخدمات مع القوانين أو اللوائح المحلية. لا تُقرّ شركة Raw Trading Ltd بأن المعلومات المتوفرة على موقعها الإلكتروني مناسبة أو صالحة للاستخدام في جميع الولايات القضائية.

    الوثائق القانونية

    © 2022 Raw Trading Ltd | All rights reserved.
    • Sample Page